Physical Address
304 North Cardinal St.
Dorchester Center, MA 02124
Physical Address
304 North Cardinal St.
Dorchester Center, MA 02124

Stock prices can bounce around more frequently than a mattress in the Kardashian household. This can make it hard to spot the overall trend of a stock.
Enter a concept many investors pay close attention to… the Moving Average.
A Moving Average (MA) is a simple tool used in technical analysis. It basically shows the average of a stock’s price over a specific number of days. Some common time frames used by investors are 20, 50 and 200 day moving averages.
Investors use different time frames for MAs based on their strategy. Short term investors tend to use shorter term time frames for their MAs and longer term investors use longer time frames.
Whatever the timeframe, MAs are helpful cuz they help smooth out the price of stocks which tend to jump around a bit from day to day. That can make it hard to pick up on the overall trend in a stock’s price. Using a MA makes it super easy to see the overall price trend.
Here’s a chart of Ford Motor Co (F). The red line is the 50 day MA.
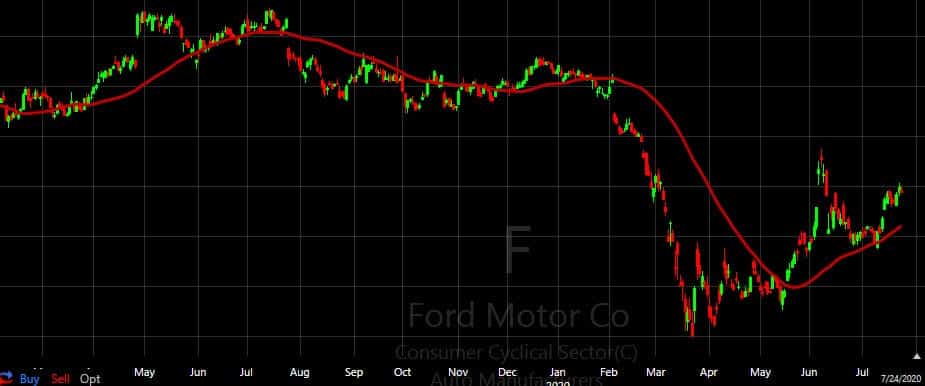
Typically if a stock’s price is above a moving average, price trending up. If the price is below the moving average, the stock price is trending down.
That said, a stock’s price may be above one moving average but below another (ie. the price may be below the 20 day MA but above the 50 day MA). So just keep in mind one MA can show and uptrend while another shows a downtrend.
Also keep in mind a moving average is a lagging indicator. That means it’s based on past price data and is not a prediction of where prices are headed in the future. Though, as you’ll see, investors do find them useful in making trades.
There are 2 main types of Moving Averages.
One is the Simple Moving Average (SMA). A Simple Moving Average simply looks back at the prices of a stock for a set number of days and divides them by the number of days to get an average.
So, a 10 day MA will add up the 10 most recent closing daily prices of a stock and divide by 10.
An Exponential Moving Average (EMA) is similar but it gives more importance to the most recent stock prices. You’re not gonna calculate this yourself so we’ll just skip covering the math here. (Besides, any decent stock chart or stock screening software will do all the math for you!)
What you really need to know about Simple vs. Exponential moving averages is:
One is not better than the other. They just work differently and, depending on your strategy, market conditions and/or the individual stocks you’re tracking, you may find one to be a better indicator for your purposes than the other.
EMAs move quicker cuz they’re weighted averages. This means the EMA can give you more and earlier signals about a change in the direction of a stock’s price. Which can be great. But it also means EMAs may give you more false signals and signals that are way too early to act on.
SMAs move much slower than EMAs. They provide fewer signals and signals that take longer to see. They also provide fewer false signals during volatile markets. But, cuz they’re slow, you may be late to a trade when using SMAs.
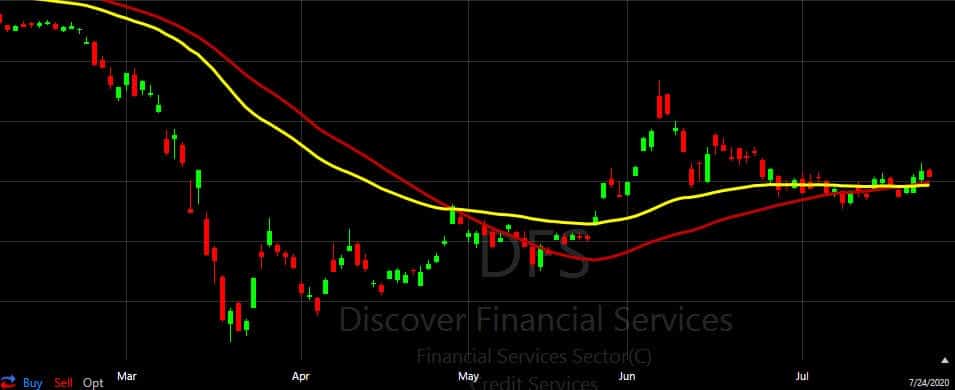
Here’s another chart of Ford Motor Co (F). The red line is the 50 day simple moving average. The yellow line is the 50 day exponential moving average. Notice how the yellow line moves more quickly based on the movement of the stock price than the red line.
So that’s your primer on moving averages. You know what they are. You know how to calculate them. You know the main types that are used.
But why should you give a flying fig about moving averages? And, more importantly, how can you use them to trade smarter and make money?
That’s the topic of our next article How to Trade Using Moving Averages.