Physical Address
304 North Cardinal St.
Dorchester Center, MA 02124
Physical Address
304 North Cardinal St.
Dorchester Center, MA 02124
In my last article, Yours Untruly covered the basics of Moving Averages. Which is all well and good.
But what do MAs really tell you? And, more importantly, how can you use them to make more successful trades?
Arguably the most important thing to understand about MAs is they are self-fulfilling prophecies. See, they are one of the most popular tools used in technical analysis to evaluate when to buy and sell stocks.
Hordes o’ traders follow them and act on their signals. So if you use the most popular MAs and place trades accordingly, then you’re trading with the crowd. And when a big enough crowd trades off the MAs, that can make the stock move in sync with MA signals.
There are a few ways traders use MAs to trade stocks. Here are a few of the common ones…
When stocks are trending up overall, longer MAs (ie. 50, 100 or 200 days) can act as a floor for stock prices. Meaning when the stock reaches that floor (or level of support), it may bounce up off of it and start rising. Some traders will place buy orders when they see a stock hitting an MA floor.
The opposite is true when stocks are trending down. In this case, an MA can act as a ceiling (resistance level) that stocks won’t climb above. The price could hit the MA and start to drop again. In this situation, some traders may short a stock when they see it hitting a resistance level as they expect the stock to start dropping.
Crossovers occur when the stock price and/or different MAs cross each other on a stock chart.
A price crossover is when the price of a stock crosses above or below a MA. This can mean the trend in the stock is changing.
If the price of a stock closes above the MA, that’s a sign the stock may start trending to the upside. If the price of a stock closes below the MA, then that could mean the stock price may start trending down.
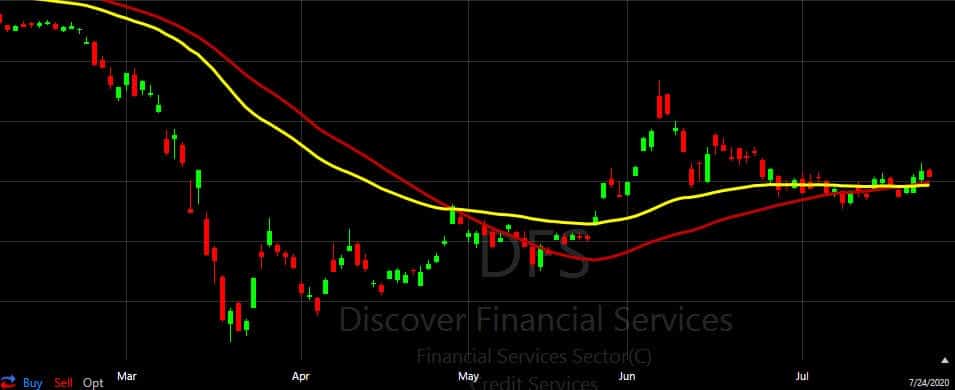
You can also look for crossovers over two moving averages of different lengths (one shorter term and one longer term) on the same chart. When you see the shorter term MA cross above the longer term MA, it can mean the stock is starting an uptrend. This is a buy signal for investors and is known as the “Golden Cross”.
If the shorter term MA crosses below the longer term MA, it’s known as a “Death Cross”. This is a signal to sell as the trend is headed down.
We hope this gives you a good overview of how to use moving averages to trade stocks. MAs are definitely helpful in evaluating the trend of a stock and time trades accordingly. However, they ain’t the end all be all. And stocks may or may not respect their MAs.
MAs tend to work better in markets/stocks where there are strong trending conditions. In choppy markets, they tend not to work as well.
Most importantly, they are just one technical indicator to use when evaluating a stock. You don’t wanna bet the farm just on MAs (or any single technical analysis tool for that matter) when it comes to trading stocks.
So go ahead and use them (you have my permission :)… just understand their limitations.