Physical Address
304 North Cardinal St.
Dorchester Center, MA 02124
Physical Address
304 North Cardinal St.
Dorchester Center, MA 02124

Do you like things that are quick and easy?
If so, the MACD (pronounced “Mack Dee” by the cool kids) may become one of your favorite new technical indicators for trading stocks. Not only is it quick and easy to use but, even better, it’s also said to be one of the more effective momentum indicators you can base trades on.
If this has whet your appetite about this indicator, let’s jump in and look at what it is and how to use it in trading.
MACD stands for Moving Average Convergence Divergence. And it’s a way to size up the trend and momentum of a stock. Which is super helpful… particularly for shorter term traders.
While easy to use, it does take a little brainpower to understand the MACD. There are a number of moving parts to it and it can be kinda hard to keep ‘em all straight. But, as always, I’ll do my best to give you a plain English, easy to understand overview.
The MACD is a line drawn on a stock chart. It gives you the short-ish term trend of price action of a stock.
It usually oscillates up and down like so…
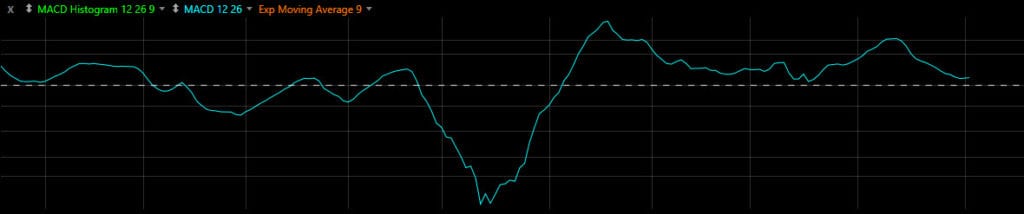
Each point on the line represents the difference between a stock’s 12 day Exponential Moving Average (EMA) and its 26 day EMA. (The 12 day and 26 EMAs are the most common time frames used to calculate MACD but can be changed based on your trading strategy. Also, if you’re wondering “what the heck is an exponential moving average?”, check out this article for the basics on Moving Averages.)
The MACD line will move above and below a centerline (or the zero line) on a chart. If the 12 day EMA is higher than the 26 day EMA, then the MACD line is above the centerline. This means the upside momentum for a stock is increasing. It’s a bullish sign.
When the 12 day EMA is below the 26 day EMA, then the MACD line will be below the centerline. This is a bearish sign that means the downside momentum for a stock is increasing.
To simplify, just remember this:
Above the centerline = Good Sign
Below the centerline = Not So Good Sign
The MACD line becomes even more helpful when it’s plotted with a Signal line (aka trigger line). It’s the orange dashed line on this chart…
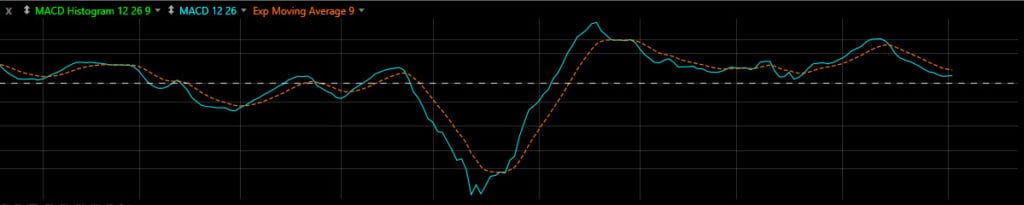
The Signal line is made by taking a 9 day exponential moving average of the MACD. It basically gives you a less choppy average of the MACD line.
More on how to use this in a minute. But there’s one more component to look at here…
The third component usually seen on the MACD chart is the Histogram. The values of the Histogram are the MACD value minus the Signal line value. It’s shown by the green and red bars on this chart…
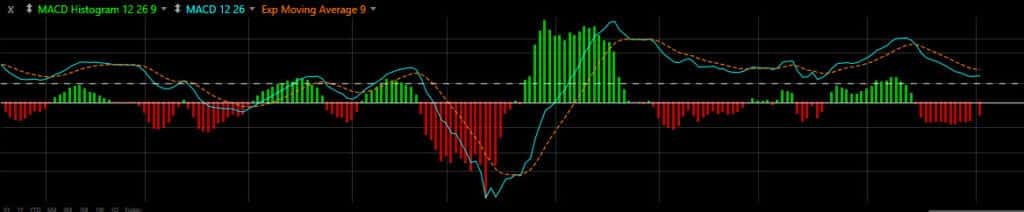
If the bars are above the zero line, the trend in price is looking good. If the bars are below, the trend in price ain’t so hot.
When the bars are getting taller, it means the difference between the 2 moving averages is diverging (getting stronger). The taller the bars, the more likely the stock’s price trend is to continue.
As the bars grow shorter (are converging), keep an eye out for a change in price trend for the stock.
Here’s the easiest, most basic way to use this indicator when trading. Ready?
Here goes…
Consider buying when the MACD line crosses above the Signal line.
Consider selling when the MACD line goes below the Signal line.
Now this ain’t perfect. Far from it. If it worked all the time, trading stocks would be easy and we’d all be millionaires.
But it ain’t bad. Look at this chart of ROKU stock…
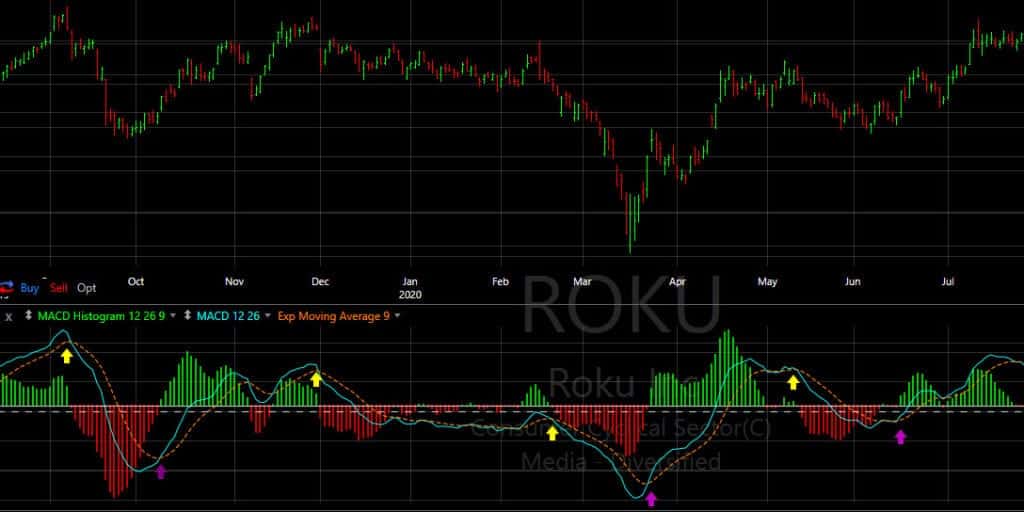
The yellow arrows highlight some points where the MACD line crosses below the Signal line. A sign to sell. In most cases, you can see the stock drops further after this happens.
The purple arrows show points where the MACD line rises above the Signal line. A sign to buy. In most cases, you’d have racked up some decent gains buying ROKU at those crosses.
No, you would not have bought at the bottom of a dip or sold at the top just by following the MACD. But you’d have made some money. Which is kinda the point of this whole investing deal.
Now I could show you plenty of charts/situations where this doesn’t work out so well. So please don’t go blindly buying/selling stocks just based on the MACD indicator and nothing else.
The MACD is a quick and easy way to size up the price action of a stock. It shows you if the price is trending up or down in the short term and how strongly that trend is, well, trending.
And as a technical indicator it’s an easy peasey (but in no way perfect!) way you can determine when to buy or sell a stock.